Myframework

Fishbone Diagram Template Download

Fishbone diagram template and worksheet
Fishbone Diagram Template

Description

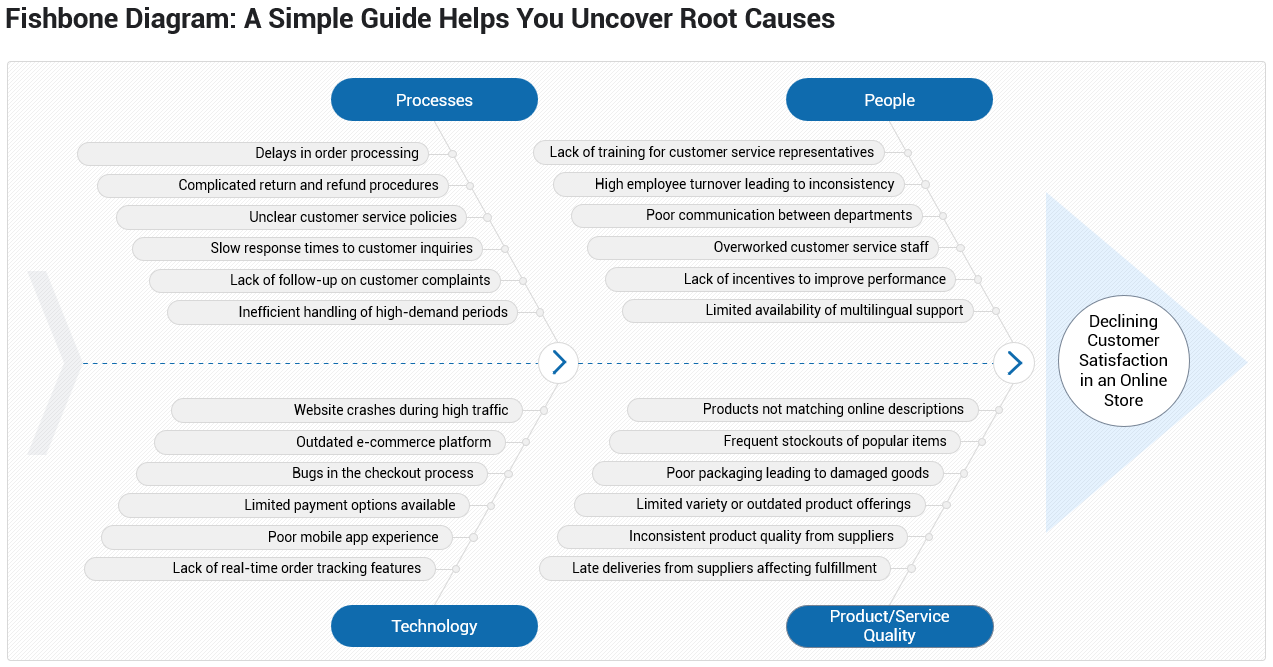
The Fishbone Diagram, also known as the Ishikawa or Cause-and-Effect Diagram, is a visual tool used to identify root causes of problems by categorizing contributing factors.

This template supports structured problem solving, making it easier for teams to analyze complex issues and develop targeted solutions.

Available in PPT format for workshops, quality improvement, and team discussions.

Use Cases

How can this template be used?

  • Identify root causes in process or quality issues
  • Facilitate brainstorming in problem-solving sessions
  • Structure team discussions around complex challenges
  • Support Lean, Six Sigma, or continuous improvement efforts
  • Present root cause analysis in reports or meetings

Download

Read the full content

This content is available to subscribers only. Sign up to unlock the content instantly.

Subscribe
Already have an account? Sign in

Stay Sharp with Framework Insightsđź‘‹

Subscribe to our newsletter and receive handpicked frameworks and templates to sharpen your leadership, decision-making, and strategic thinking.

Myframework

Great! You’ve successfully signed up.

Welcome back! You've successfully signed in.

You've successfully subscribed to Myframework.

Success! Check your email for magic link to sign-in.

Success! Your billing info has been updated.

Your billing was not updated.